I love thinking about product. My ideal day is equal parts building analytics in Omni and trying to nudge every workflow in the app toward magic. But to build a truly great company you need more than an outstanding product, you need a business machine that works. And to build a successful business, you need to follow (and continuously challenge) a financial model tuned for efficiency.
To help others, I wanted to share how we’re thinking about building scalability into our growth, and even share an example of a first financial model that young start-ups can use to wrap their head around the levers for growth. Below, I’ll explore benchmark numbers from publicly available sources and conversations with business leaders to help demonstrate how a start-up financial model can come together. By understanding these pieces, you start building the foundation of operational decision making - when to slow down, focus on quality, and build vs. when to press into the market and reach for more customers.
Building a start-up's first financial model #
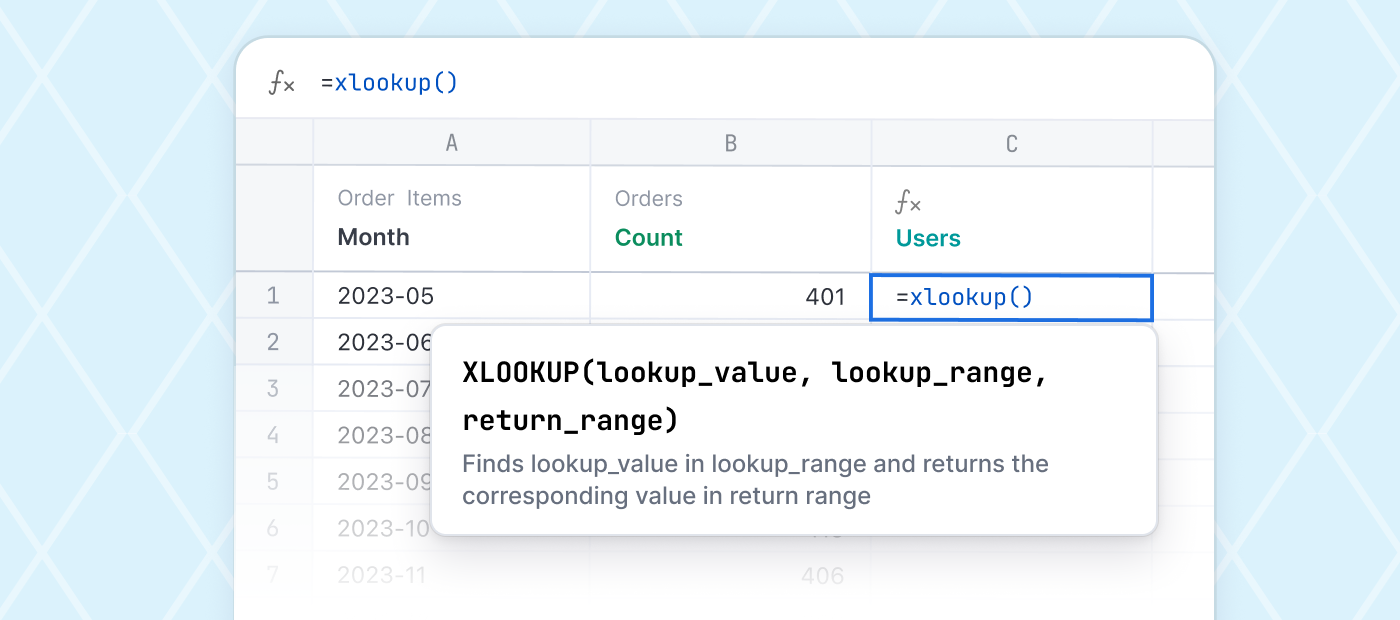
I started my career in finance, and I still believe Excel is one of the greatest pieces of software ever built (more on that to come in another post). The nicest part about working in spreadsheets is how you can start with the basics and slowly inject complexity by refactoring every single line item into multiple inputs.
This is how we started with financial modeling: a top-level line item for money in the bank, and some basic linear growth of spending until the money is gone. Unfortunately, it didn’t give much to work with in the way of decision making - beyond some crude estimates. When we announced our commercial availability recently, we knew it was time for an upgrade. We needed to start building a go-to-market plan and a scalable financial model.
And, below are key considerations you can take into account if you’re in a similar position.
Quick aside on the SaaS sales model #
Before getting into the financial model, I want to lay out our thinking on building a B2B sales model. Lots of good things have been written about building sales teams - Kellblog, Saastr, Tomasz Tunguz’ blog (love this one too).
The machine is relatively simple - hire sales reps to bring in new business. Assuming software margins and reasonable payback periods, a sales rep hitting quota can fund their supporting functions, and the business will grow consistently if customer retention is strong.


Source: Tomasz Tunguz, The Other Payback Period that Matters in SaaS, February 2016
This means that modeling the business is a combination of understanding sales hiring, the support staff they pull through (sales engineering, SDR, marketing), and customer retention.
Similar to many new SaaS companies, we want to complement this with more product-led growth or product-led sales, including a self-service tier. However, first we want to prioritize creating an outstanding customer experience where we can work hand in hand with our early partners. This aligns with a sales-led motion and the example I’ll share below.
Modeling a sales team #
To get started, put together several tables of unit economics - similar to the graphs shown above. What is a sales rep’s OTE (On Target Earnings, or what they’ll make if they hit 100% of quota)? What is the right ratio of sales engineer to sales or SDR to sales, etc.? When doing this exercise for Omni, this step was also the first place we realized we needed to refine the financial model, but we’ll get to that. (Hat tip to Keenan Rice and everyone who shared benchmarks so we could pull together some starter numbers.)
Now before going further, I have to share this* disclaimer*: The below calculations are not pulled from Omni's actual numbers. I used publicly available data to pre-populate expected salaries; they may be completely different for you. Part of the exercise is getting assumptions down on paper so you can challenge and adjust them. The example ratios I used for the sake of this post will not be your ratios. And if your business requires sales reps at $25k OTE, you’ll need to adjust expectations.
Okay, now let’s take a quick look:

The other important lever here is the ratios. For Omni, acquiring new customers is a joint process between SDRs setting meetings, a sales team consisting of a sales rep and sales engineer, and then often an implementation analyst to help build out an early analytical environment. Services engagement in SaaS is a topic for another post, but consultative sales can be very effective for complex and broad tools, such as business intelligence or CRM. Now, all that said, the above is more like what you expect at maturity.
For now, the model may look very different:

Now, with a sales team modeled out, you can start the financial model. Using something similar to the example above, we did that at Omni, and…the numbers looked great! Unfortunately, that was because we’re missing half of the company if this is the only planned hiring. While every other role in the business is not as tightly coupled to sales hiring, we wanted to get some numbers down to straw-man out actual expected growth.
But first, let’s take a look at the production side of a sales team.
Building a booking model #
Similar to above, the core idea is to get assumptions written down to challenge them with reality. We’re just building out the classic sales funnel: leads become qualified leads → those leads take meetings (or if you are PLG, this may represent free users) → hopefully many of those meetings and trials turn into paying customers.
Here’s a first cut of that model:

So now you know what activity in front of each sales rep needs to look like, and you can start building a sense of how many reps this can support and the marketing pipeline generation needed to hire more. Again, the goal is to refine these progressively - ACVs trend up as customers mature, and lead quality can have an enormous impact on lead:meeting ratios, etc.
Keen readers will also note this model is a little too generous, as well. This implicitly treats all revenue as margin. The next step was honing these assumptions, and accounting for the additional complexities of a real business.
Enriching the model #
Now, it’s time to think about profitability - how much of that $24k ACV do you get to keep? The two biggest inputs here are the cost of support and technical infrastructure. Note there may be other components to the model, but these were the two most obvious levers to start with. For infrastructure COGs (Cost of Goods Sold), in this example I kept it simple and used 10% - this will vary wildly based on the type of software you are building.
For the support and customer success component, it’s helpful to create another quick template to challenge efficiency ratios over time. Originally, this was rolled into sales headcount, but I wanted to rebase the load on support and customer success to customer logos.
Here’s how you can think about it:

I’ll keep reiterating, but this is less about the exact numbers and more about the ratios, and per-customer costs. In this example, you can ballpark the per-customer employee costs around $4k per year - about 16% of revenue, probably a little high vs. where you want to be at scale (call it 5-7%). So, this is something to focus on over time.
One other enrichment we’ve layered into this example is management. As you continue building the model, it’s important to reflect that every employee isn’t on quota or working directly with customers. To handle managers, think about adding a span of control (think managers per employee) to gross up ratios. For support and success, this means a manager every 270 customers or so with an 8:1 ratio. However, you can explore differences in the spreadsheet and the impact on costs.
Next, it was time to fix the sales team model. For reps to get enough pipeline you need marketers, and this is also a good time to layer in managers.
Here’s the updated sales team:

The above chart shows a couple of changes. First, we’ve added in marketers and spend per AE on customer acquisition. As with everything, these will evolve over time, but I built some buffer into the sales machine for getting reps meetings. And, paralleling customer success, I’ve also added managers to the model to cover the sales team and marketers - again using the 8:1 ratio, though now controllable.
Now, you have the v0 sales model. Already this early model already has a few important metrics. A full sales team costs $527k per year. This sets a floor to a 12m payback now or later - incredibly important to understand.
A few more adjustments #
Now it’s time to dial in the rest of the business because you’ll be hiring more than sales teams. This meant some quick accounting for R&D hiring and G&A functions. Candidly, I didn’t have a great sense of how to benchmark the growth of these, so I leaned into some reverse engineering.
In this example, I set expected salaries (again based on benchmarks) and simply tied them to sales ratios. This model used 0.5 tech hires per sales rep and 0.3 G&A hires per rep. The nice aspect of tying these to sales hiring is you can build a fully corporate-loaded sales team - the sales team and all of the supporting functions to build the product and company. Then, you can look at the sales & marketing, general & administrative, and research & development ratios over time to confirm they conform with norms and expectations.
Finally - to reflect real employee costs rather than just salaries, I added in a gross-up for costs like payroll, healthcare, travel, and supporting software of 20%.
The result is a full table of assumptions:

Note I’ve also included some placeholders for the current team, burn, and money raised along with a few other levers around quota attainment, gross churn, and add-on revenue. Admittedly, all of these could be enriched to produce a more detailed model.
I’ve highlighted in red, a pair of the most important metrics for the business - net attainment ($750k quota, with 80% attainment = $600k of attainment) and fully-fully loaded sales team (with all the drag along functions) of $800k. Right away you can see that the unit economics need to be refined to operate at cash breakeven, but there’s a clear starting point.
I’ve also included a few other ratios like cost per meeting, margin calculations across the support team, etc. These help get a ballpark for the underlying levers in managing efficiency.
Bringing it together #
To build the forecast, it’s simply building a hiring plan and wiring everything up. I’ve plugged in a naive growth model to get started:

Now, there’s a good sense of achievable growth and the scale of the example business along the way. This, of course, comes with financial impact, as it’s burning $200k per sales team in the first year. It’s also important to be careful of overly optimistic growth forecasting here, but, again, the exercise is instructive more than anything.
Here are a few other tables of metrics:

For this business, they’ll run out of cash in mid-2025, so they have some adjustments to make to improve the economics or raise funding. You can also validate the ratios, this is a sales-heavy business quickly:

Final thoughts #
There are hundreds of ways to slice up this data and evaluate ratios when building a start-up’s first financial model. But hopefully, this example data and business provides a framework for thinking about your business levers. PLG companies may prefer a marketing-driven model to one run through sales teams, but similar adjustments could be made by tuning assumptions.
The key here is to create a framework for challenging each assumption as you grow - a place to outperform or under-perform expectations, and clear ARR and burn outcomes. We’re happy to share the sheet if you send me a note, also would love thoughts on what we missed and how we can improve the model.