This post is inspired by Tristan’s great post now >5 years old! As the former VP product at Looker, I’ve sent versions of this post to more start-ups than I can recall. In recent years, I’ve been asked more about the increasingly complex data landscape. I’ll take a pass at refreshing the landscape but recognize the high-level advice is largely timeless, enjoy this analytics guide for start-up’s.
Why analytics #
Let’s start by agreeing that everyone can make better decisions with data. Whether you are an executive driving strategy in the boardroom, a product manager prioritizing feature development, a customer support associate helping solve a users problem, a sales leader focused on helping your team find success this quarter, you need to understand the business context to make better decisions. From strategic to tactical, analytics should power start up decisions at all levels of an organization.
The analytics ecosystem is changing incredibly quickly. There is a cambrian explosion of innovation happening at all levels of the analytics stack from infrastructure to tooling often called the Modern Data Stack (MDS). The Omni team was part of driving some of this innovation at companies like Looker, Google, Stitch, RJ Metrics with technologies like LookML, dbt, Singer.
Companies like Canva have teams to set up and maintain 8 - 10 vendors (just for their infrastructure) from Segment and Fivetran for collection and EL, Snowflake for a data warehouse, dbt for T in Prefect, Dagster or Airflow for orchestration, Monte Carlo for data operations, High Touch for reverse ETL, Tableau and Looker for notebooking and BI and Atlan for discovery. This is in addition to their transactional database in Postgres, their SaaS services like Stripe, Front, Salesforce, Hubspot and so many more.
To implement this stack it requires not just the cost of the various vendors but teams of 5-10 analysts, analytics engineers, data engineers, software engineers, to set up, integrate and maintain these tools. These systems tend to be fragile. Your business is constantly changing, your operations are changing, data is the exhaust and changes too. Without thoughtful integration the management of this infrastructure can be overbearing.
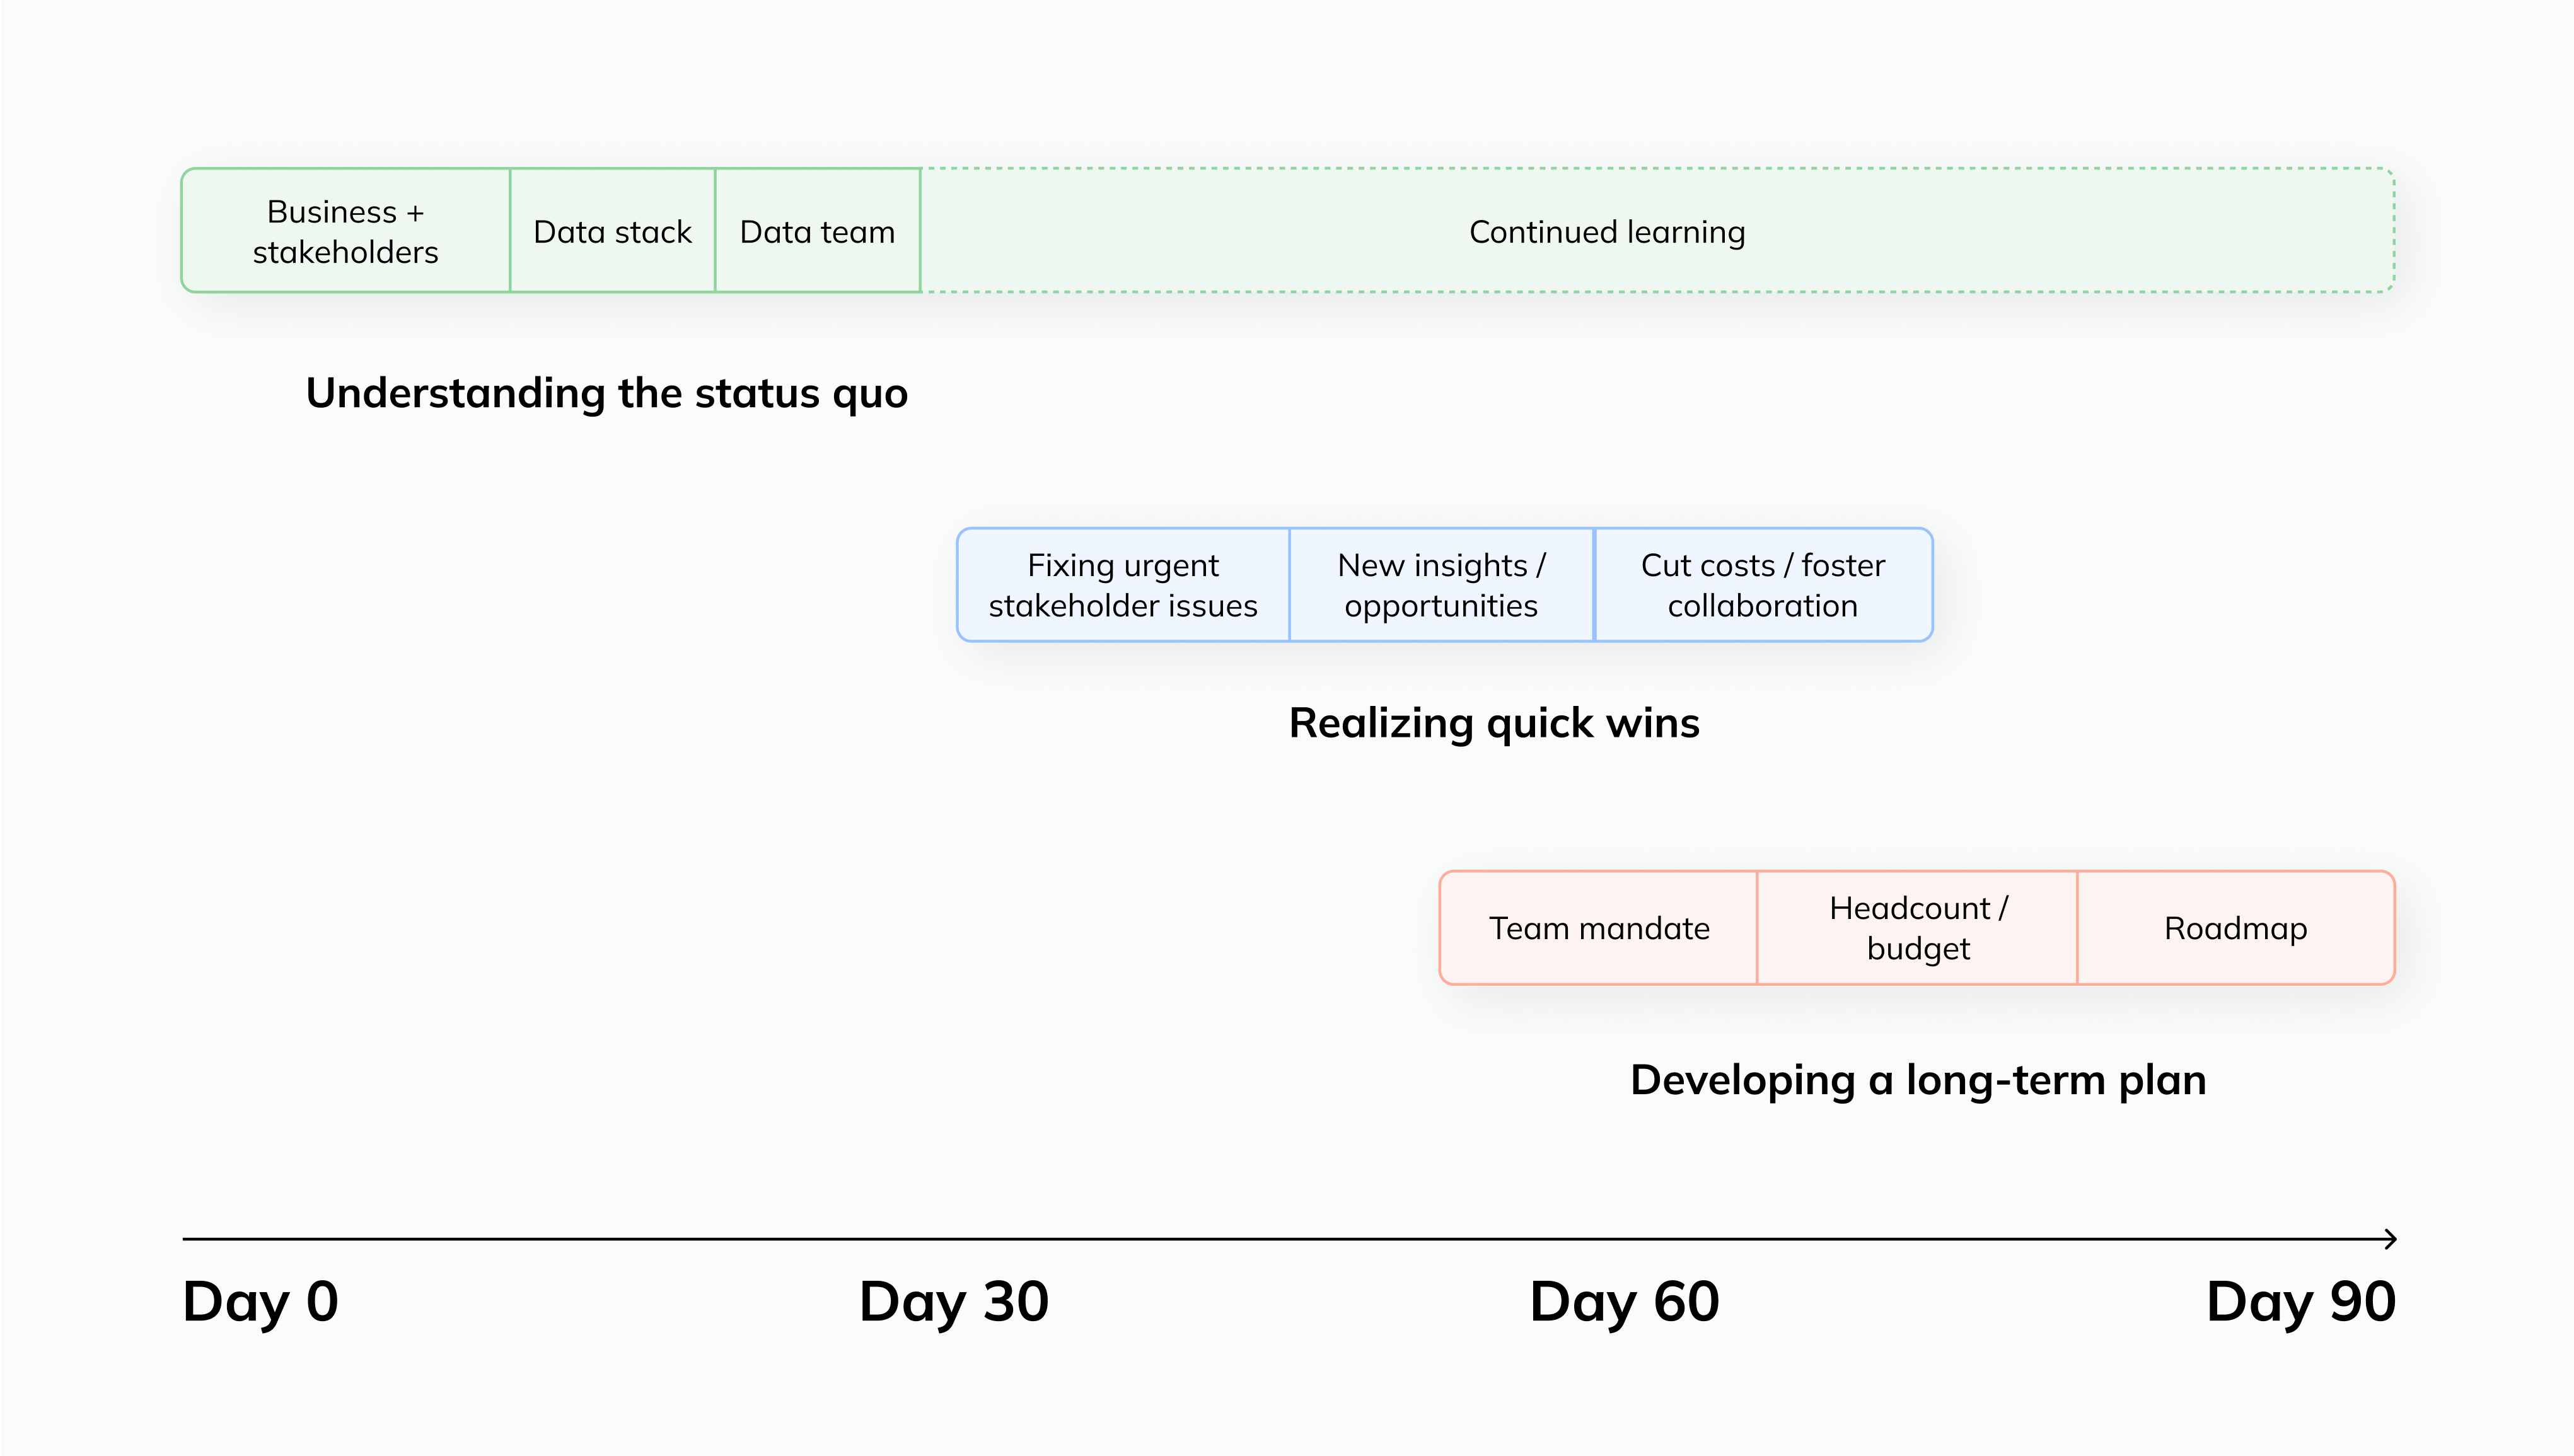
Let’s walk through a framework for how startups should think about creating a data-driven culture by examining how and when to use technology to reinforce operational processes. At the highest level, I like to frame this as “Crawl, Walk, Run” with the principle of avoiding premature optimization but allowing for future sophistication.
There are a few discrete break points for where things often change for a data-driven organization. #
Crawl: Beyond spreadsheets 🔢
Founder led analysis
Out of the box tools that provide incredible time to value.
Walk: Cloud data warehouse 📈
First analytics hire supporting the business teams
Graduate from pre-built reporting to needing more complexity - often combining different data sets or more complex analysis
How do users from marketing channel X use the product?
What do renewals look like for customers with X support tickets?
Implement a EL tool (Fivetran) into a cloud data warehouse (Snowflake) coupled with modern BI
Run: Data driven platform 🤯
Mature data team (>1), with a tribe of analysts (can be centralized or embedded). Often this looks like an analyst for Customer Success, Sales, Marketing, Product and a data engineering team
Fully fledged MDS
Multiple departmental use cases
Let’s look at how to approach these stages. #
First …Moving beyond spreadsheets 🔢
Crawl: Pre-seed, Seed
First you need data.
Your company is just getting started and there is infinitely more work than time to do it. This stage is characterized by rapid iteration on product in conjunction with as much feedback as possible from customers. The entire company is focused on development and as a result, you’ll never be closer to the details of usage and the business. Your intuition will be data-driven and comprehensive. Trust your instincts, Luke.
Here you want to instrument your product so that you can iterate as quickly as possible and retain your touch on the pulse of your business. This should be out of the box analytics vendors like Google Analytics or Amplitude.
Recommended Stack: Google Analytics, Google Sheets
Second ...Move data into a cloud data warehouse 📈
Walk: Early stage Series A - C Shared place for the data
The business is growing and the team is as well to support that growth. There is increased specialization in functions. Data is now needed not just by the SQL speaking technical teams but increasingly from the business operations. The SQL analyst can rapidly become a bottleneck here. The out of the box tools no longer can address the increasing complex questions. How did this product launch affect customers from this marketing channel and what does that mean for the supply chain?
Often time preparing board slides is a breaking point. At first founders can scramble to pull together the necessary sales and marketing metrics. To start this is ad hoc but over time the repetition begs for automation. Data bottlenecks are typically felt close to revenue for a business in B2C companies this tends to be marketing and product and in B2B this can be sales. Partner organizations often have shared interest in the analysis.
The first place folks often start asking ad hoc questions is typically an internal transactional database that powers their application. As you start to layer on additional department use cases and complexity, use EL vendors like Fivetran, Stitch or Airbyte and replicate the most important SaaS vendor data (typically Stripe or Salesforce and Google Ads, Facebook Ads) and your transaction system into a centralized cloud data warehouse like Snowflake or BigQuery.
This is where you want to start to develop a shared place for consuming and collaborating on data.
First, you want tools that can take advantage of the power and scale of the data warehouse.
Second, you need to embrace that at this stage your business isn’t static. You’ll be doing ad hoc analysis. You’ll be rapidly changing schemas due to product and operations changes. Spreadsheets and SQL are your friends.
Third, you want to create an ability to democratize access. Not everyone that needs the data will know SQL. Embracing tools that enable end users to self-serve will transform the data analyst from a bottleneck to a force multiplier for organization.
In our past lives, we often saw this stack being a combination of BI experiences that can be adopted in a layered iterative approach. It might be that organizations start with a SQL running experience like Mode and over time adopt Looker to enable a more consistent reporting layer.
We’ve designed Omni to combine the power and freedom of SQL in a workbook with the consistency of a shared data model.
Recommended Stack: Fivetran, Snowflake, Omni 😉
Third ...Invest in process and technology for a data driven platform 🤯
Run: Growth Series C+ Process to help control chaos.
The business is growing, the team is growing and complexity increases even faster. You are growing your data team and may have hired analysts embedded in business functions like sales, product, marketing or analysts. As complexity increases, change management processes are even more important. Your product and operations are changing, your understanding of your business is changing, your data and metrics change downstream. There needs to be coordination and data should never gate improvements that drive the business.
The board deck again often is a leading indicator for the complexity of the business. When the executive dashboard is generated the data inputs need to be consistent. Why does marketing report ARR as X and sales as Y? Slightly different assumptions can lead to materially different numbers and incorrect downstream decisions.
Organizationally, larger and increasingly siloed teams lead to more coordination costs. When there was a single data engineer sitting with engineering, anticipating and adapting to changing production schemas happened automatically. As teams grow change can happen faster without awareness.
A common platform that can ensure consistency, and allows for testable change management is important. Data operations can ensure the reliability of data and alert about schema changes that will break downstream content or workflows. dbt is excellent for manually defining consistency and optimizing for cost performance. Tools like Monte Carlo and Big Eye are good compliments to FiveTran, Snowflake and a BI platform.
As an organization’s need for data increases, inevitably analysts become a bottleneck. The business wants every analysis in every permutation e.g. can we look at the sales funnel for these product lines, in these regions, for these timeframes? Analysts are forced to live in JIRA or a Slack channel reacting to requests vs. proactively doing strategic work. At Looker, we called this data breadlines. 🍞
There are two dimensions to consider when data teams act as internal consultants or service desks. #
First, self-serve vs. service orientation: Is the data team primarily creating and maintaining tools for the business to answer their questions directly or are they gate keepers necessary for every subsequent analysis. The answer should drive BI platform choice.
BI platforms come in two primary modes, workbook and centralized. Workbook tools are immediate time to value and allow an analyst to take a dataset and slice and dice it to derive and communicate insight. But because it is so easy to generate a report, everyone in the organization does. Suddenly, when looking for the canonical sale pipeline, the business finds 15 different reports with slightly different assumptions. Chaos!
Centralized tools can serve to define metrics in a single place. These tools require a heavy investment upfront and more subtly a continued investment overtime. Until an organization is ready this investment may not pay off.
Organizations have a need for both ad hoc exploration and centralized reporting to address sophisticated analysts and the business. You can couple it together with dbt and Tableau or Looker and Data Studio. We think these use cases are mutually beneficial and should sit in one tool.
Second, centralized vs. embedded data teams: when a team is small and an organization’s operations simple a single analyst can understand the technical generation of data and the business context to serve any question in the organization. As the complexity increases it requires increased specialization.
Data teams are good at understanding and addressing technical complexity but need to work hand in hand with business constituents to understand operations and context. Data teams are thinking of their work as a product for the business. This can be done with a centralized team that partners with line of business counterparts but requires training the lines of business on data infrastructure and analysis best practices. This can be successful as a “center of excellence”.
Data expertise can also sit within the line of business. Analysts can sit in departments and have the context of the business needs. In hub and spoke configurations, there can be a platform data team that manages shared infrastructure and often enforces definitions of key metrics.
Extra bonus...Going beyond reporting. 🚀 #
The value of data infrastructure is driving business outcomes. The ROI of data is realized with improved decision making. Removing friction from the realization of that value should be the focus of data practitioners. Naturally this includes storing the data, processing, deriving insight, communicating, and finally acting on it. New categories of data catalogs, like Atlan, Alation, Datahub, Amundsen help with discovery, communication and deriving insight, and reverse ETL, like Census and Hightouch enable new action, are opening up the landscape and purvey of data teams.
To enable better decisions, companies need to get the right data and insight to the right user at the right moment. Not everyone in your business will be logging into a BI tool everyday. This requires data to be integrated into all of your workflows. Whether this is an embedded dashboard with a prospects usage of a free trial in Salesforce for the Account Executive creating value or a custom application built for supply chain managers that pulls in historical inventory and pricing information for the manager on a warehouse floor. This classically has been called embedded analysis and more recently called headless BI.
Recommended Stack: Fivetran, Snowflake, dbt, Monte Carlo, Omni 😉
In summary, data competency is no longer a competitive advantage, expertise is table stakes for a modern organization. A thoughtful approach to both technology and cultural foundations allow for pragmatic investments without precluding further sophistication as your business increases in complexity. Using this Start-ups Guide to Analytics to “Crawl, Walk, Run” allows an organization to solve the largest problems and get the most value from becoming data driven by addressing structural issues as they develop.
Let us know if you’d like to give it a try!. We look forward to your feedback.