A reflection on how far the market has come: #
I was recently looking back at a number of Mary Meeker’s internet trend presentations from the past 10 years and was struck by a few thoughts as I started my new role at Omni. The presentation from 2013 had a small section dedicated to data and talked more about consumers and their use of technology rather than the data they were creating or how it might be used. 2016 had the first mention of business intelligence and by 2019, an entire section dedicated to data, analysis, and tooling had made its way into the key topics. As someone who has watched and worked in the data space, it is hard to think back to a time when data was not considered.
The last ten years have created a complete shift in how data is used, who is using it, and the tools surrounding the entire ecosystem. Data literacy has also increased, making the non-technical employee savvy to create analysis and contribute to data discovery. This has created a need for a new set of tools that can make all users productive. A quick glance back at the history of BI might be a good starting point to understand how far we have come…and how the products on the market have changed drastically based on user needs.
A glance back at the history of BI: #
Back in the 1990’s the importance of data was just being realized and harnessed by organizations. Databases were slow and expensive, so companies needed a solution to store and analyze data that wasn’t the transactional system. Business Intelligence (BI) applications like Business Objects, Cognos, & Microstrategy dominated the market by taking data, moving it into their system to creating cubes to perform specific types of analysis. This created a notion of strong governance and trust since there was a single source of truth and definitions could be audited. It did not give end-users of the system much flexibility to ask and answer new questions.
The process of getting a new slice of data or creating a new metric or KPI was very technical, requiring subject matter experts who know both the data and its structure as well as the application language being used. Users began to get frustrated with constantly having to wait for data teams and data engineers to get them the data that was needed to run the business. In many cases, users would have to wait weeks just to see a new simple slice or report.
With the next set of tools in the 2000s, the market reacted and the pendulum swung drastically in the other direction moving away from governance and to a model of self-service. Self-service tools like Tableau and PowerBI allowed end-users to connect to disparate data sources and quickly create analysis with custom metrics and definitions. This untied the hands of users and allowed many more individuals to have the access to and flexibility with the data that they needed.
What many data leaders did not realize is that they gave back too much control to the end user. This created a new issue that had been previously solved by the legacy tools of the 90s. Metric and artifact definitions were no longer governed and it was not always clear who had defined concepts correctly. There was not a great way to audit or share and collaborate over analyses. There was clearly a need for both modeled data and self-service exploration.
In the 2010s, the next significant shift in the space happened as database technology started to quickly advance, making it much easier and cheaper to analyze and store large volumes of data. SQL-based tools connected directly to databases like Redshift, Bigquery, and Snowflake to leverage the horsepower that they now provided for repeatable analysis.
The market overcorrected and drastically swung back towards a model of governance built on top of modern technology. Looker started to bring together the concepts of data modeling and self-service governed analysis. This meant that users could now quickly create analysis in flexible pre-canned environments for asking and answering questions. Modeling concepts from the legacy tools were modernized and made more flexible in an attempt to meet users' needs. There was now a modern web-based system that could be trusted and integrated with other tools to deliver data to the places where users spent the most time. This created a new paradigm that further exposed more individuals to use data in their work.
Maintenance of both SQL-based tools and modern modeling tools is cumbersome and doesn’t provide the correct balance of agility and freedom with governance and trust that the new savvy user needs.
The paradigm shift to a set of new expectations from new users: #
In each phase of the market evolution more and more individuals have been exposed to and become comfortable using data. It is now fair to say that regardless of the role or industry that someone works in, data will be a critical part of success. The products in the market have moved back and forth between self-service and governance as reactions to the products have driven innovation.
Each phase has created and highlighted key value propositions for what the current workforce needs to be successful:
A Data Model = Governance and Trust
Self-service = Flexibility to Define & Incorporate Data
Modern Architecture = Freedom to Integrate & Leverage Existing Technology
To serve the modern data organization with a diverse set of data users, a new tool is needed that brings together the best of all the phases of the data landscape history. A balance needs to be met, that strikes a middle ground and doesn’t overreact to the current needs of the market.
The new world that brings everything together: #
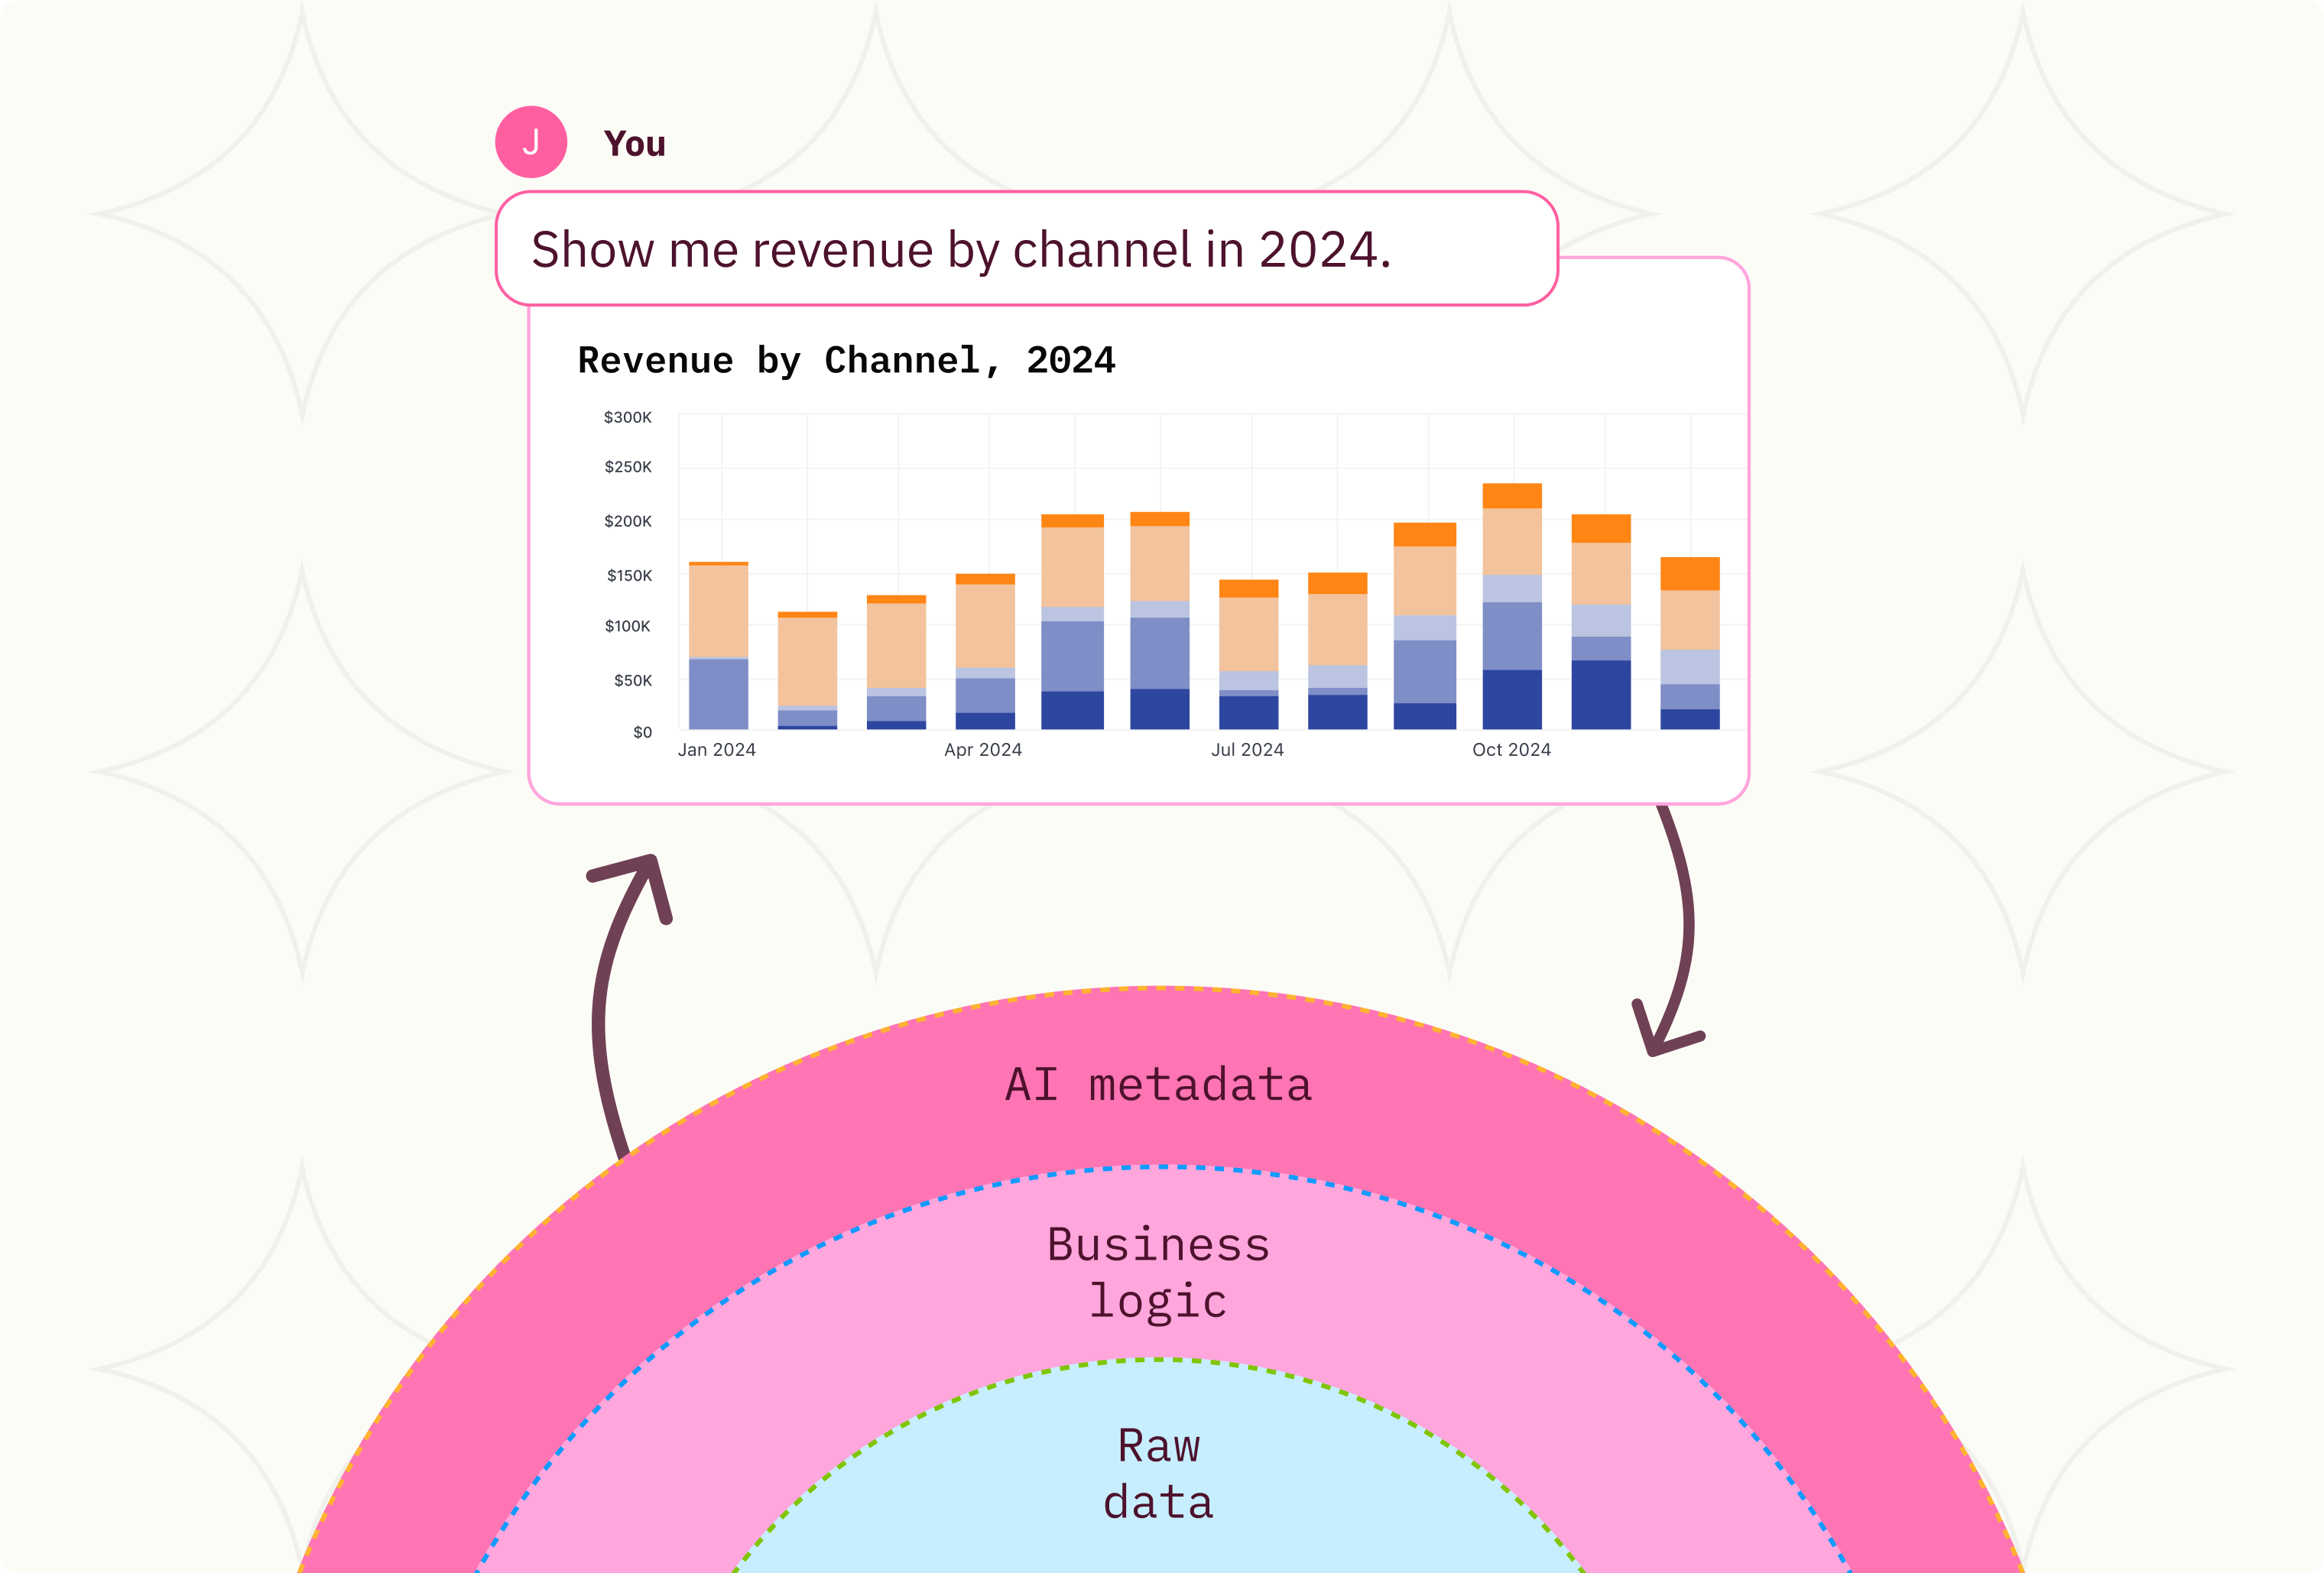
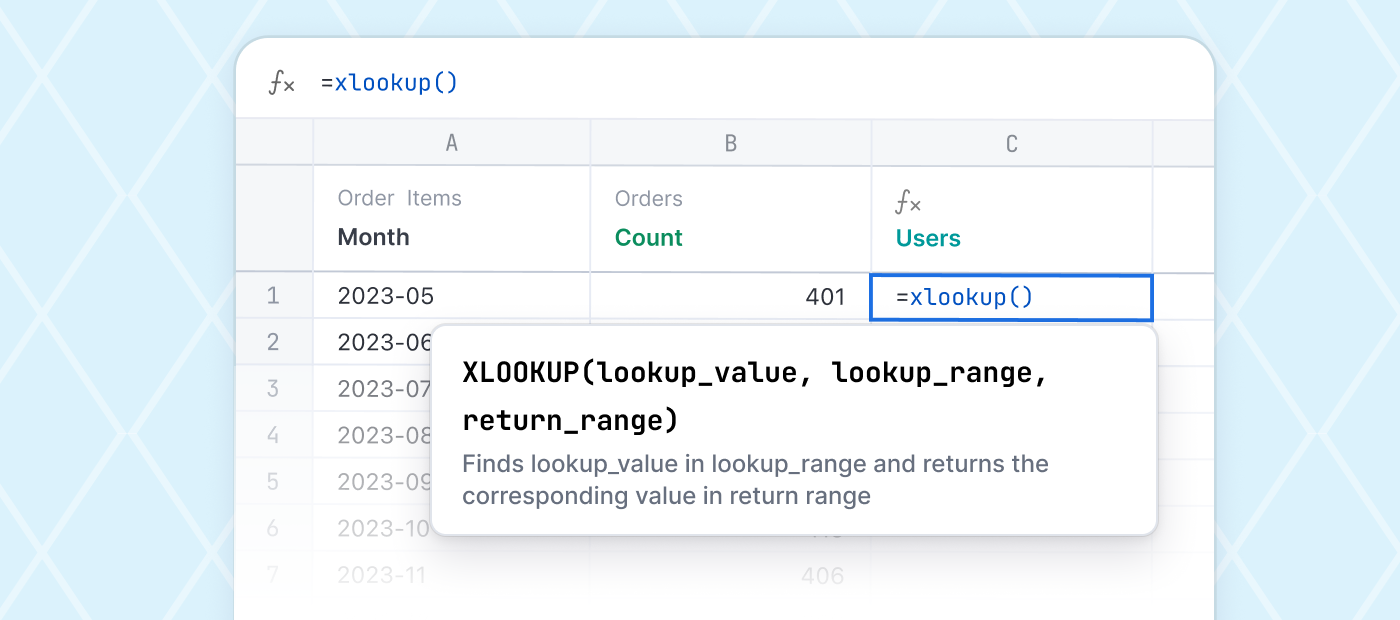
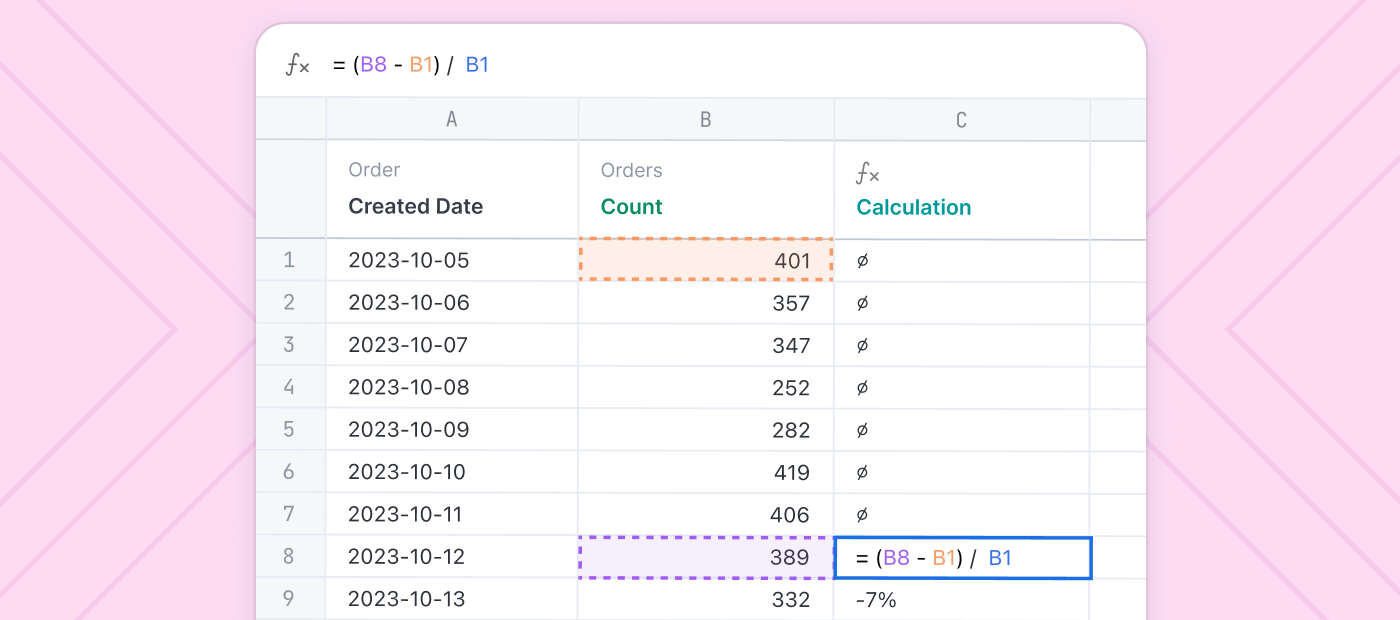
In this new world of data literacy and access, users need a tool that will give them the best of the workbook, SQL, and data modeling tools. Omni allows users to access a shared data model to leverage governed metrics and definitions while allowing for the creation and merging of custom fields and datasets. CSVs and Excel files will be able to be married to production data sources to create new analyses on the fly. Most importantly when artifacts need to be reused, they can be pushed back into the shared data model with an agile promotion process.
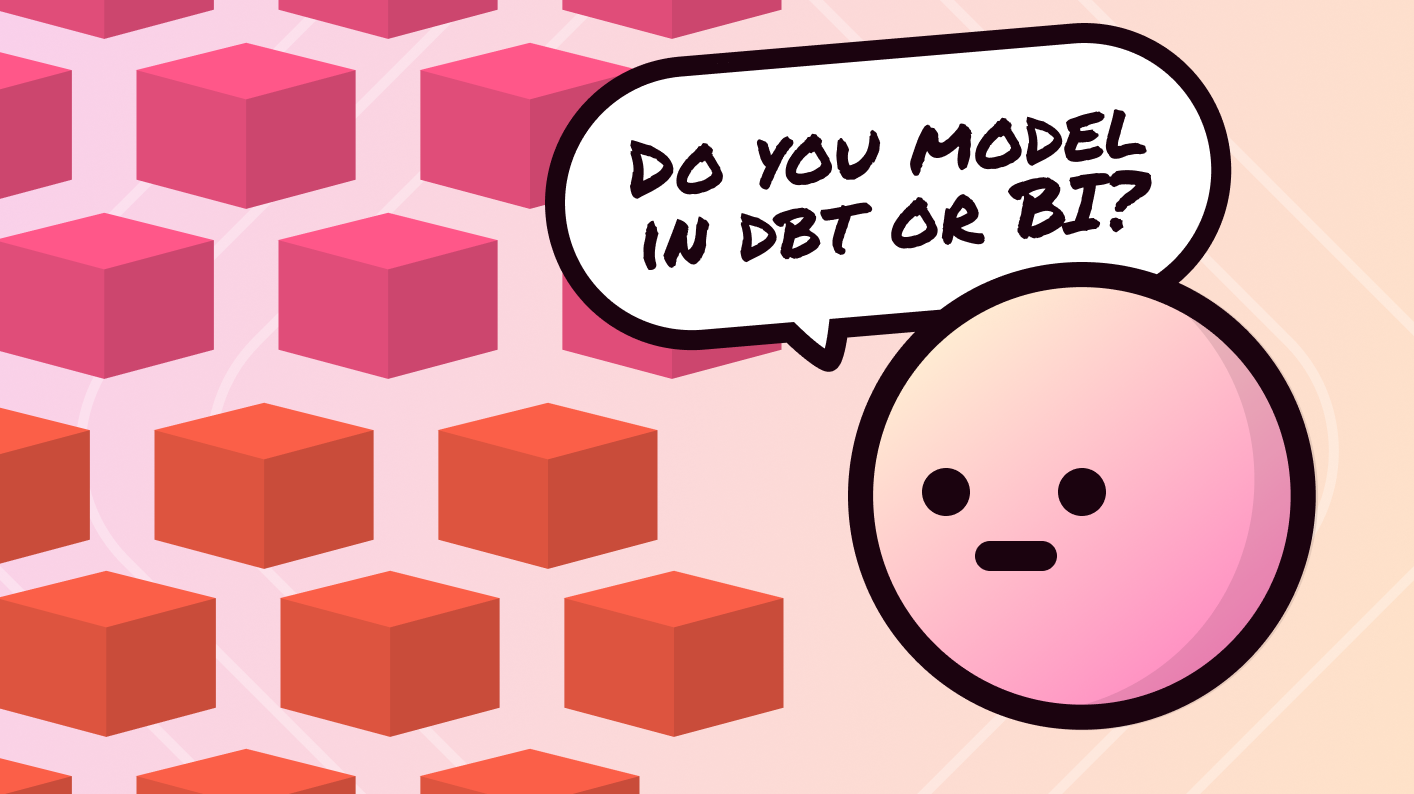
Integration with DBT brings the modern data stack to life with a simplified process to move table and metrics definitions into the data layer that it needs to live in. Curated visualizations allow for out-of-the-box chart suggestions, with full customizability to meet complex needs.
Our goal at Omni is to build a world-class BI tool that takes the learnings from the past 20 years and brings together the best aspects of the workbook visualization, SQL, and data modeling products. This will allow for the dissemination of critical metrics and enable interactive data exploration. End-users are able to trust the results they are getting back while making the changes they need. Data teams are able to govern, curate, and audit the use of data and maintain consistency in reporting across the organization.
In my time working with BOBJ, Microstrategy, Tableau, Power BI, Periscope, and Looker it is clear that each product has filled a specific need and shifted the market based on the feature set and value that it brought to the table. Looker specifically shifted the paradigm around the need for a modern data model. While this was what the market needed at the time, we are now at a time when users need access to governed core metrics and the flexibility to create and test new KPIs without large amounts of overheard or maintenance. The need to do lightweight modeling through a UI and iterate quickly is more important than ever.
We would love to show you our vision and take you through the art of the possible.
Sign up to receive a demo & see for yourself.